
Data Analytics Latest 2022
What Is Data Analytics?
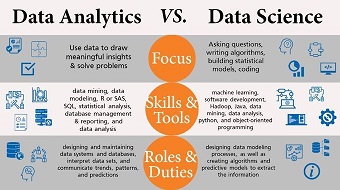
Data analytics is the science of analyzing raw data to make conclusions about that information. Many of the techniques and processes of data analytics have been automated into mechanical processes and algorithms that work over raw data for human consumption.
KEY TAKEAWAYS
- Data analytics is the science of analyzing raw data to make conclusions about that information.
- Data analytics help a business optimize its performance, perform more efficiently, maximize profit, or make more strategically-guided decisions.
- The techniques and processes of data analytics have been automated into mechanical processes and algorithms that work over raw data for human consumption.
- Various approaches to data analytics include looking at what happened (descriptive analytics), why something happened (diagnostic analytics), what is going to happen (predictive analytics), or what should be done next (prescriptive analytics).
- Data analytics relies on a variety of software tools ranging from spreadsheets, data visualization, and reporting tools, data mining programs, or open-source languages for the greatest data manipulation.
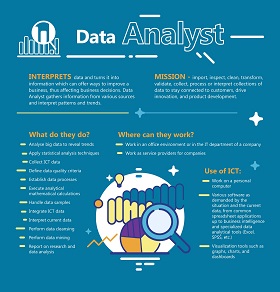
Understanding Data Analytics
Data analytics is a broad term that encompasses many diverse types of data analysis. Any type of information can be subjected to data analytics techniques to get insight that can be used to improve things. Data analytics techniques can reveal trends and metrics that would otherwise be lost in the mass of information. This information can then be used to optimize processes to increase the overall efficiency of a business or system.
For example, manufacturing companies often record the runtime, downtime, and work queue for various machines and then analyze the data to better plan the workloads so the machines operate closer to peak capacity.
Data analytics can do much more than point out bottlenecks in production. Gaming companies use data analytics to set reward schedules for players that keep the majority of players active in the game. Content companies use many of the same data analytics to keep you clicking, watching, or re-organizing content to get another view or another click.
Data analytics is important because it helps businesses optimize their performances. Implementing it into the business model means companies can help reduce costs by identifying more efficient ways of doing business and by storing large amounts of data. A company can also use data analytics to make better business decisions and help analyze customer trends and satisfaction, which can lead to new—and better—products and services.
Data Analysis Steps
The process involved in data analysis involves several different steps:
- The first step is to determine the data requirements or how the data is grouped. Data may be separated by age, demographic, income, or gender. Data values may be numerical or be divided by category.
- The second step in data analytics is the process of collecting it. This can be done through a variety of sources such as computers, online sources, cameras, environmental sources, or through personnel.
- Once the data is collected, it must be organized so it can be analyzed. This may take place on a spreadsheet or other form of software that can take statistical data.
- The data is then cleaned up before analysis. This means it is scrubbed and checked to ensure there is no duplication or error, and that it is not incomplete. This step helps correct any errors before it goes on to a data analyst to be analyzed.
Types of Data Analytics
Data analytics is broken down into four basic types.
- Descriptive analytics: This describes what has happened over a given period of time. Have the number of views gone up? Are sales stronger this month than last?
- Diagnostic analytics: This focuses more on why something happened. This involves more diverse data inputs and a bit of hypothesizing. Did the weather affect beer sales? Did that latest marketing campaign impact sales?
- Predictive analytics: This moves to what is likely going to happen in the near term. What happened to sales the last time we had a hot summer? How many weather models predict a hot summer this year?
- Prescriptive analytics: This suggests a course of action. If the likelihood of a hot summer is measured as an average of these five weather models is above 58%, we should add an evening shift to the brewery and rent an additional tank to increase output.
Data analytics underpins many quality control systems in the financial world, including the ever-popular Six Sigma program. If you aren’t properly measuring something—whether it’s your weight or the number of defects per million in a production line—it is nearly impossible to optimize it.
Some of the sectors that have adopted the use of data analytics include the travel and hospitality industry, where turnarounds can be quick. This industry can collect customer data and figure out where the problems, if any, lie and how to fix them.
Healthcare combines the use of high volumes of structured and unstructured data and uses data analytics to make quick decisions. Similarly, the retail industry uses copious amounts of data to meet the ever-changing demands of shoppers. The information retailers collect and analyze can help them identify trends, recommend products, and increase profits.
Data Analytics Techniques
There are several different analytical methods and techniques data analysts can use to process data and extract information. Some of the most popular methods are listed below.
Regression analysis entails analyzing the relationship between dependent variables to determine how a change in one may affect the change in another.
Factor analysis entails taking a large data set and shrinking it to a smaller data set. The goal of this maneuver is to attempt to discover hidden trends that would otherwise have been more difficult to see.
Cohort analysis is the process of breaking a data set into groups of similar data, often broken into a customer demographic. This allows data analysts and other users of data analytics to further dive into the numbers relating to a specific subset of data.
Monte Carlo simulations model the probability of different outcomes happening. Often used for risk mitigation and loss prevention, these simulations incorporate multiple values and variables and often have greater forecasting capabilities than other data analytics approaches.
Time series analysis tracks data over time and solidifies the relationship between the value of a data point and the occurrence of the data point. This data analysis technique is usually used to spot cyclical trends or to project financial forecasts.
Data Analytics Tools
In addition to a broad range of mathematical and statistical approaches to crunching numbers, data analytics has rapidly evolved in technological capabilities. Today, data analysts have a broad range of software tools to help acquire data, store information, process data, and report findings.
Data analytics has always had loose ties to spreadsheets and Microsoft Excel. Now, data analysts also often interact with raw programming languages to transform and manipulate databases. Open-source languages such as Python are often utilized. More specific tools for data analytics like R can be used for statistical analysis or graphical modeling.
Data analysts also have help when reporting or communicating findings. Both Tableau and Power BI are data visualization and analysis tools to compile information, perform data analytics, and distribute results via dashboards and reports.
Other tools are also emerging to assist data analysts. SAS is an analytics platform that can assist with data mining, while Apache Spark is an open-source platform useful for processing large sets of data. Data analysts now have a broad range of technological capabilities to further enhance the value they deliver to their company.
Why Is Data Analytics Important?
Data analytics is important because it helps businesses optimize their performances. Implementing it into the business model means companies can help reduce costs by identifying more efficient ways of doing business. A company can also use data analytics to make better business decisions and help analyze customer trends and satisfaction, which can lead to new—and better—products and services.
What Are the 4 Types of Data Analytics?
Data analytics is broken down into four basic types. Descriptive analytics describes what has happened over a given period. Diagnostic analytics focuses more on why something happened. Predictive analytics moves to what is likely going to happen in the near term. Finally, prescriptive analytics suggests a course of action.
Who Is Using Data Analytics?
Data analytics has been adopted by several sectors, such as the travel and hospitality industry, where turnarounds can be quick. This industry can collect customer data and figure out where the problems, if any, lie and how to fix them. Healthcare is another sector that combines the use of high volumes of structured and unstructured data and data analytics can help in making quick decisions. Similarly, the retail industry uses copious amounts of data to meet the ever-changing demands of shoppers.
The Bottom Line
In a world increasingly becoming reliant on information and gathering statistics, data analytics helps individuals and organizations make sure of their data. Using a variety of tools and techniques, a set of raw numbers can be transformed into informative, educational insights that drive decision-making and thoughtful management.
Buy From Amazon Click Here
Read More About Embedded Systems Click Here